Motion thresholds are a function of what parts of the retinae are seeing the motion. Interestingly, we have relatively poorer motion thresholds in the foveal regions of our retinae. But our motion thresholds are relatively much lower (i.e., better) at the periphery of our retinae. You may occasionally become aware of this, when you detect motion to your side and move your eyes and head to engage with the oncoming motion. Motion thresholds also nicely illustrate the importance of peripheral vision. Most of the functions of the visual system discussed have involved the region of the visual field near and around the fovea. Color and much of the discussion of form relate to the fovea and near it. Yet motion is a function that does very well at the periphery. It is tempting to think of our peripheral vision as merely poor vision, or a poor version of how vision operates in the fovea. However, that would be a mistake. Vision at the periphery is not so much poorer as different. The relative importance of acuity and motion in the fovea and at the periphery gives some insight into this different. A moving stimulus at the periphery seems to grab the attention, and may even direct the fovea over to this stimulus.
As with any other perceptual feature of vision, we can ask a few basic psychophysical questions about motion thresholds. In this experiment, you can try to determine the smallest (called Motion Jump in this experiment) or slowest motion (called Motion Smooth in this experiment) that can be detected using the Method of Limits (see Chapter 2 if you need a review). You can position the stimulus nearer or father from the fovea to see how motion threshold changes as you go out to the periphery. Try the claims from the paragraph above.
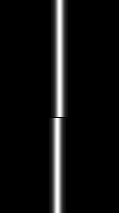
Since this discussion compares motion to other sensitivities, you can also measure two other types of acuity, Checkerboard and Vernier. Checkerboard is a good stimulus for determining our standard acuity. Ask yourself if you can see the individual checks. Verier acuity is the ability to detect breaks in a line like the one shown below. Can you see that the top line is farther to the right than the bottom line? Our ability to see these offsets is remarkable and represents what is called a hyperacuity, an acuity that we can detect even smaller stimuli than for normal acuity.

To see the illustration in full screen, which is recommended, press the Full Screen button, which appears at the top of the page.
On this tab you can adjust the type of stimulus and the various parameters of the stimulus to see how this might effect the acuity thresholds. The settings include the following:
Stimulus Type: what type of stimulus are you used to determine the acuity
thresold:
Checkerboard (can you see the individual checks),
Vernier (can you see a break in the line).
Motion Jump (can you see a discrete motion)
Motion Smooth (can you seem motion continuing for one second)
Contrast: the relative intensity of the stimulus to the background as a proporition of the total range
of light change possible.
Stimulus Position: the position of the stimulus on the screen relative to the
left edge where the fixation mark is.
Background Level: brightness of the background against which the dot is to be detected (in the basic intensity values of the screen). The dot values are differences from this level.
Reset At the top of the settings page is a Reset button. Pressing this button restores the method settings to their default values.
On this tab you can adjust how the method will work. The settings include the following:
Number of Levels of Critical Feature Size: How many steps there are in the staircase (series).
Number of Staircases: How many staircases (series) will be presented (always an even number).
Minimum Value of Critical Feature Size: What is the smallest critical feature to be displayed.
Maximum Value of Critical Feature Size: What is the largest critical feature to be displayed.
Reset At the top of the settings page is a Reset button. Pressing this button restores the stimulus settings to their default values.
On the Experiment tab, press a space button or the button on the screen to start the experiment.
Keep your eyes fixated on the red plus sign at the left side of the screen. If one of the two motion
stimuli have been selected a square with a grating will be presented and stay on.
After a breif delay, the checkerboard or verier stimulus will be presented or the grating
will be moved. It will depend upon your stimulus type selection.
After this event, buttons will appear asking you have see the critical feature.
For checkerboard stimuli, it will ask if you can see the checks.
For vernier stimuli, it will as if you can see the break.
For the two motion stimuli, it will as if you can see the motion.
Click or press yes (or press the 'z' key)
if you have and no (or press the '/' key) if you have
not seen the dot. When the experiment has been completed, you will instructed that you can view your results.
You data will presented on this tab where the trials will be on the x axis and the intensity value of the stimulus will be displayed on the y axis. To see your threshold, which is the average of the cross-overs, click the button that says Show Threshold. To display the trial by trial data, click the Show Data button.
Change the settings below to alter the stimulus parameters in this experiment.