Many psychophysical experiments have looked at the perceptual reality of color matching. These experiments are known as metameric color matching experiments (Silverstein & Merrifield, 1985). Metamers are a psychophysical color match between two patches of light that have different sets of wavelengths. This means that metamers are two patches of color that look identical to us in color but are made up of different physical combinations of wavelengths. For example, a monochromatic light of 520 nm looks green. But we can create a color that looks identical by balancing the right amount of light at 420 nm, 480nm, and 620 nm wavelengths of light.
In an experiment on metameric matching, an observer is shown two patches of light. One is called the test patch, and the other is called the comparison patch. The test patch is a single wavelength of an unchanging illumination or brightness (e.g., a monochromatic light of 520 nm at a set brightness). The comparison patch is composed of three primary colors, such as the red, green, and blue used in a television. The observer has control over the intensity of the three lights in the comparison patch. The observer’s task is to adjust the levels of each of the three primary colors in order to make the color of the comparison patch to that of the test patch. When the observer does this to his or her satisfaction, a metameric match is achieved for that individual. In general, a match that satisfies one individual will also satisfy other individuals of normal color vision abilities.
In this experiment, you can try to make metameric matches using a method of adjustment technique to determine your PSE.
To see the illustration in full screen, which is recommended, press the Full Screen button, which appears at the top of the page.
Please refer to this image for the stimulus settings.
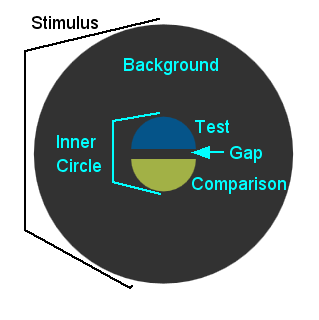
Test (top) Color: choose the color of the test. The test is
the color you are trying to match. It is the top of the two half circles of color in the image.
The color you have chosen is shown in a square just to the right of the color wheel.
Gap Size: the size of the gap between the test and comparison.
It can range from 0, which is where the two half circles are next to each other to 50 pixels.
Stimulus Size (% of half screen width): the size of entire stimulus field
including the grey background.
Size of Inner Circle(% of stimulus size): the size of the colored circle (test and comparison combined) as
a percentage of the overall stimulus size.
Background Level: the intensity of the background. The units are the units used by the display to create intensity.
Reset: at the top of the settings page is a Reset button. Pressing this button restores the method settings to their default values.
On this tab you can adjust how the method will work. The settings include the following:
Number of Trials in the Experiment: how many times you will make your adjustment.
Range of Variation of Color Change: over what range will the starting value of the stimulus
change. The range is a percentage of the total range of values the stimulus can have.
Reset: at the top of the settings page is a Reset button. Pressing this button restores the stimulus settings to their default values.
On the Experiment tab, press the space bar or the Start button on the screen to start the experiment.
The test and comparison will be presented as two half circles in the middle of the screen.
The standard is the top half circle and the comparsion, the one you adjust, is the bottom
half circle.
Your task is to adjust the color of the comparison so that it matches the color of the test.
Use the sliders at the bottom of the screen. You have one to control each of the three primaries of your monitor,
red, green and blue.
When you have made your match, click the Match button to the right of the slider to proceed to the next trial.
Your data will be presented on this tab. On the x-axis will be the trials. On the y-axis will be the value of your dependent measure that you set when you pressed the Match button on that trial. To see your PSE, click the button that says Show PSE. To display the data for all of the trials, click the Show Data button.
Change the settings below to alter the stimulus parameters in this experiment.